
The Highgate community crowd-funded a second air quality survey and this blog presents the results.
The main conclusions:
1. Highgate’s main thoroughfares still have illegal levels of (NO2) air pollution.
2. Overall air quality has not changed in the last year – where we repeated tests in the same place, some results were up and some were down but only one (on the High Street) was significantly higher. No message can be drawn about the general trend of emissions, up or down.
3. We tested air quality inside and outside shops and found materially lower levels inside. This will be a relief to traders and customers.
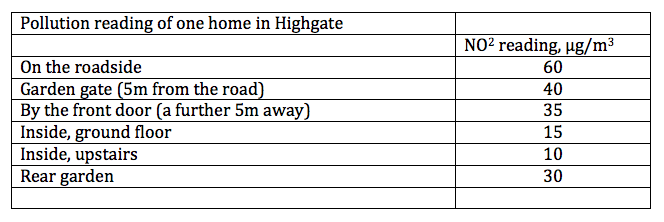
4. Comprehensive testing around one house and that showed that there is a steep gradient from high pollution in the middle of the street, to the garden and then into the house. Living on a highly polluted road need not produce worryingly high pollution inside the home.
5. We went seeking high readings and found some spots in Highgate which are double the legal level.
The Forum will be responding to the recently announced Government consultation (“Improving air quality: national plan for tackling nitrogen dioxide in our towns and cities“) but we will also be expecting our local representatives (Haringey MP and councillors, and Camden MP and councillors) to ensure that Haringey and Camden, take air quality seriously and help us to improve our air. We will also ask our representatives to press the GLA and TfL, as the Mayor’s plans seem to offer no hope of relief to Highgate.
One of the pressing concerns of the Highgate Forum is air quality. This is a key driver of much that we want to do regarding traffic, notably reducing commuter traffic, improving bus routes and making Highgate a nicer place to walk and cycle. First, though we needed to know just how bad our air quality was. We crowd funded the money to conduct tests last year (of NO2 air pollution using diffusion sensors) and the results are written up and were presented at last year’s AGM. (Last year’s report explains the background to the sensors and the importance of NO2.) We raised more money during the winter, put up the sensors in March, brought them down a month later, and sent them for analysis. It is the results of those tests that are presented in this blog.
Our strategy this time was to repeat the measurement in some of the locations but then to do some “tests”. The background to this strategy was the realisation last time that the gradient from a heavily polluted area (a busy junction for example) to the side streets just a moment’s walk away seems to be steep. You can go, it seemed, from readings way over the legal limit to half the legal limit in a 100 metres. We wanted to see how “local” the pollution was, and although this does little to reduce the scale of the problem faced on our main roads it might bode well for Highgate more generally.
The results:
1. High pollution on main roads
The High Street and Archway Road, the Forum’s main thoroughfares, (still) have illegal levels of pollution. This is why the Forum will argue for cleaner buses and reduced commuter traffic. Not many residents or visitors to Highgate will fail to be on one of those streets at some point and experience the smell and pollutants.
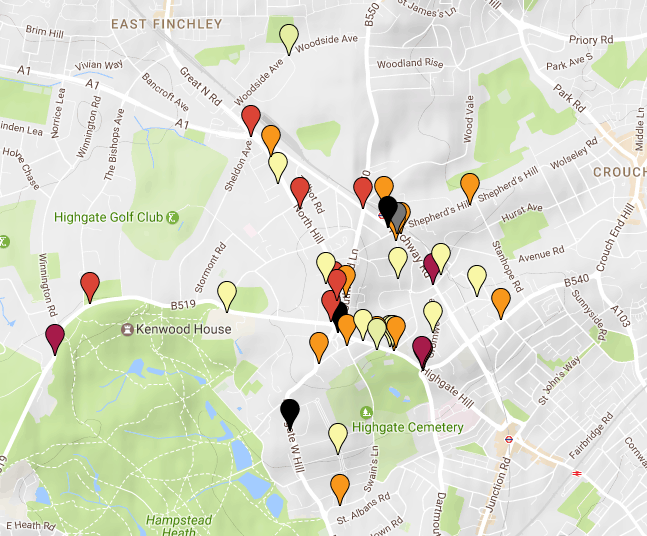
The map below shows where the sensors were located. The darker the colour, the worse the situation: black are roughly double the legal limit (40μg/m3) while the reds are above the limit.
2. Unchanged pollution in the last year
There is no evidence that the works at the Archway gyratory and subsequent (seemingly modest) rerouting of traffic has had any impact on pollution readings in the area. It is reassuring that the concerns (at least on pollution) expressed by some seem to have (at this stage) come to nothing.
All the usual caveats expressed in the Forum’s pollution report from last year apply: pollution in Highgate is in part dependent on what’s happening more broadly (for example, across London, the weather, seasonal impacts) and there is the normal volatility of readings with these diffusion tubes.
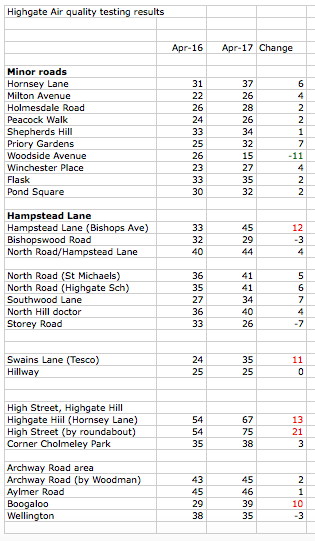
The table below shows the readings in those locations that were surveyed last year and again this year. That four-fifths of the readings this year are within 7μg/m3 of where they were last year gives reassurance about the overall consistency of the measurement system and of our understanding of the pollution in Highgate. It was probably unreasonable to expect any real change, up or down, in pollution in the last year given the lack of action London-wide and no changes (yet) in Highgate. These things tend to change slowly.
3. In-shop pollution
Naturally one concern after the last survey was that the high pollution levels on the street would translate to high pollution in the shops and businesses on the same streets. The readings do not support this fear. Readings inside shops were normally about half of that outside. In one case a reading in the high 30s outside matched a reading in the high teens inside. Another in-shop reading was just over 20 but that was at a more polluted part of the High Street. In other words, despite high pollution on a main road, the door seems to keep internal pollution down to, or below, the rates seen in side streets or in our parks. This might be different in summer in the case of those shops that have open doors.
4. Domestic impact from NO2
We used some of the sensors to see how pollution had an impact on a house located on a main road. While any excessive NO2 is viewed as undesirable, our test gives reassurance that the bulk of the on-street pollution does not make it into the home. The reading inside the house was roughly one-quarter of that in the middle of the street and under half that in the garden.
Much will, we imagine, depend on how often the front door opens. We did a test on a block of flats too and found that the hallway reading was only about 5μg/m3 lower than the reading a metre or two away outside the building.
It seems that height is not a great diffuser of pollution. Again, we only conducted one test so the conclusion is tentative but the reading on the roof of Cholmeley Lodge (Highgate Hill) was just below (and not significantly below) the reading at ground level.
5. Seeking high readings
In last year’s exercise we learnt about the steep gradient of pollution. So this time we tried to see what were the highest readings we could find. This did not involve a big adjustment on our part but it did confirm in our minds that buses groaning to pull away on an uphill stretch of road is where you can get the most pollution. As the map above shows, the readings about half way up Highgate West Hill, by the Hornsey Lane junction of Highgate Hill and by the bus stop outside Jackson’s Lane Centre were the highest. The roundabout at the top of the High Street was also a black spot but that is probably the junction with the most consistently slow moving, stop-start traffic in Highgate. While the Archway Road junction with Muswell Hill Road has more traffic (though not much more) the traffic often flows freely, unlike the village roundabout, giving rise to less pollution.
Credits
I would like to thank Ian Henghes, Roch Briscoe and Marjolaine Briscoe for their help in selecting sensor locations and putting them up and bringing them down. It takes longer than imagined and their help speeds up the process no end!
0 Comments